SDS 192 Project 1
SDS 192
Plot 1
Plot 2
Blog post
The data we are working with for our research and findings is the College Scorecard Institution-Level Data. This dataset provides information about institutions as a whole and also specific fields of study in the United States. This data was produced by federal reports by institutions, financial aid data, and tax data. Specifically, we are focusing on post secondary institutions in Massachusetts in 2021. Our guiding question is in Massachusetts in 2021, are private, non profit, or public schools thriving in terms of student popularity? To investigate this broad topic, we look at the data from private, non profit, and public post secondary schools data including their number of undergraduate students and their admissions rate.
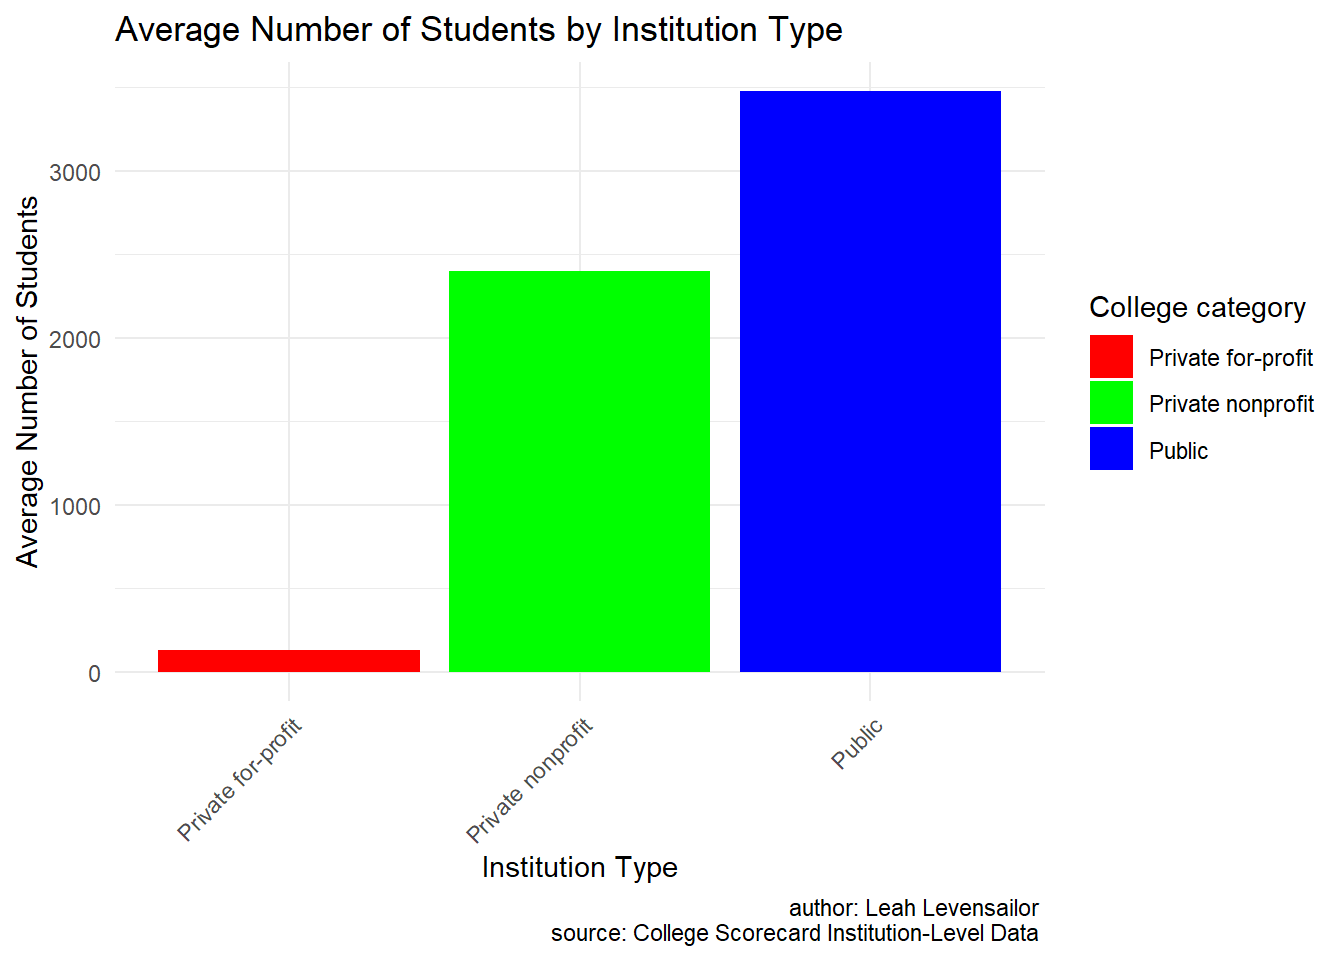
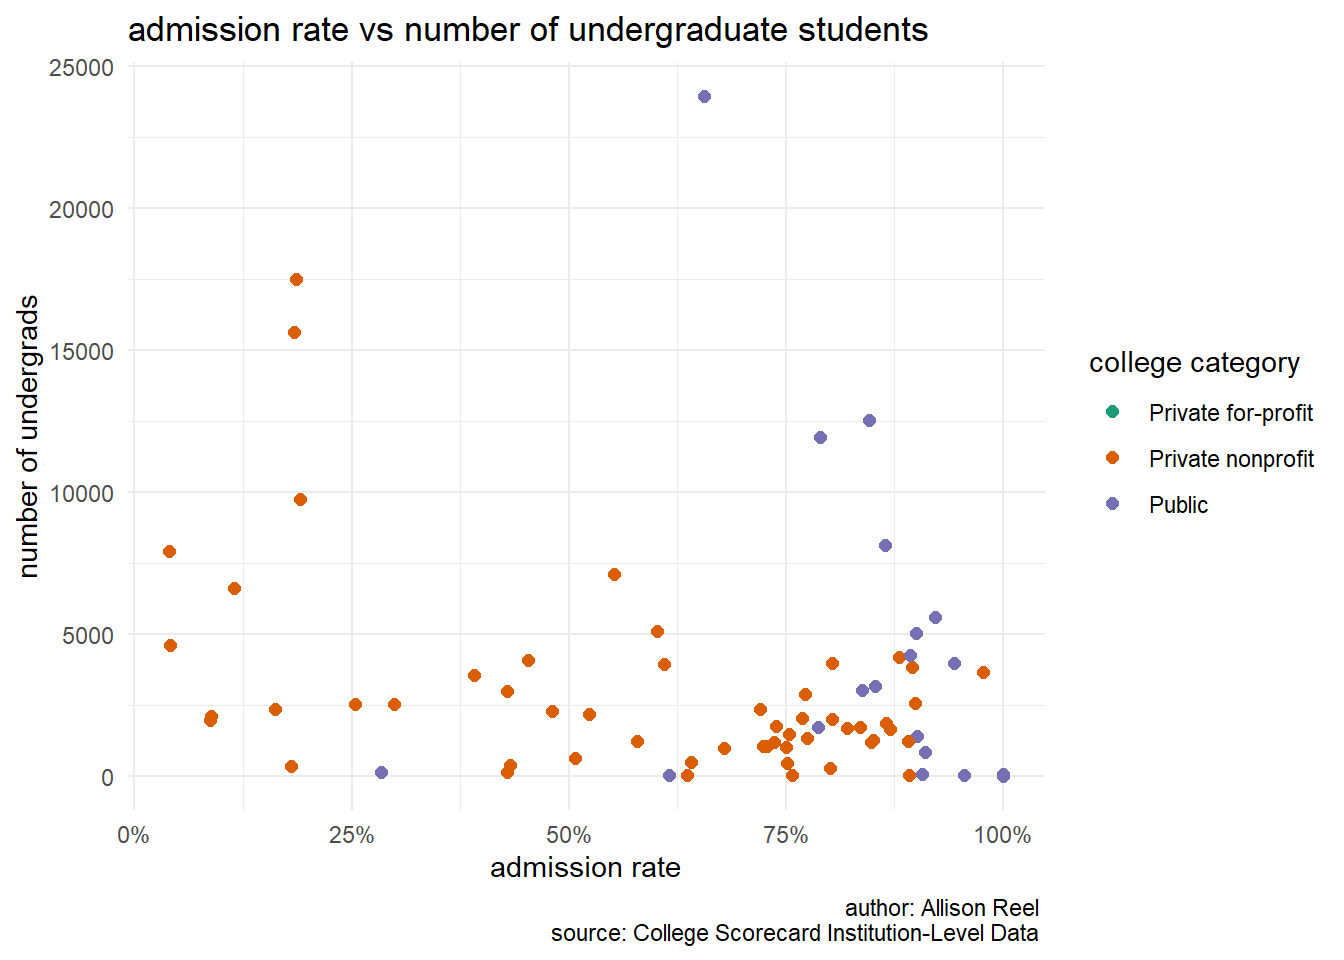
Our first plot looks at the relationship between average number of students and type of institution. The graph is split into three separate bars for each institution type: public, private non-profit, and private for-profit. We can conclude from this graph that typically the public institutions in Massachusetts have a higher number of students with an average of 3480 students per institution. The outlier is the Private For-Profit average number of students with 151 students. This number is brought down by the smaller specialized schools such as Empire Beauty School-Boston with only 87 people in the undergraduate population. The public universities in this graph don’t show a great discrepancy between the public and private non-profit institutions but in reality, there is such a large gap between the largest and smallest number of students in all of the public universities. The average is brought down by all of the smaller public schools. Our second plot looks at the relationship between admissions rate and number of undergraduate students, colored by the status of private, non profit, and public institutions. From this graph, we observe that for public institutions, the vast majority have a very high admission rate but hover around an average number of undergraduate students enrolled. This implies that public colleges/universities are relatively popular, as they admit a large number of students while having an average number of undergraduates enrolled. For private institutions, they are evenly spread along the admission rate, while remaining comparable numbers of undergraduate enrollment. We conclude from this information that since these colleges and universities have a similar number of undergraduates as public institutions, but often lower admission rates, they are more popular than public institutions.
The key takeaway from our analysis is that public institutions have larger student populations than private or nonprofit institutions, indicating a level of popularity, but have higher admission rates, indicating a possibility of less popularity in terms of applicant pool. The data collected for this dataset is those institutions that receive federal funding. The institutions collect their own data, and may have different ways of doing so, possibly leading to different reports and non-standardized data collection. This data also provides financial information in terms of the institution to families and applicants, but not the culture or surroundings of the college itself, including city or town living expenses.